Hidden gems of debugging
May 25, 2019• ☕️☕️ 8 min read
Anything that cut some of your arduous task time is good for your productivity. Debugging is one of those strenuous tasks. Developers strive to write bug-free code, but we all know that this is far from true. No one likes to see bugs in their code—those red color lines are not very appealing, right? Nonetheless, errors are good if you happen to catch them early. Debugging them properly will give you new learning and a feeling of satisfaction. There were countless moments when I learned a lot while debugging my own code and seeing how it could challenge my own concepts.
We all learn by making mistakes, and make mistakes again to learn more.
Enough of motivation. Let’s get to business.
Today, I am going to share some of the tricks and tips you could use to supercharge your debugging skills. I’ve only tried these tricks in chrome dev tools (sorry FireFox users), but some of them are browser agnostic.
1. Using shorthand object property value notation in console.log
This is my favourite console.log trick and has to be on top of the list. You must have written torrents of console statements in your code base trying to figure out the value of a variable. The Convenience of use has made ”console” the leader of the debugging championship 🏆. The golden line looks like this:
// highlight-next-line
 console.log(a);
This is awesome and you get to open up your console dev tool to see the value. But, as the number of lines grows, it becomes hard to trace the reference of that particular value.
 console.log(a); // prints 20
 console.log(b); // prints 30
 console.log(c); // prints 40
// Sorry what was the reference variable for '30'? I am kind of lost😕
A very obvious solution to this would be to dump in some string representation along with your variable. Thanks to the versatile nature of console.
 console.log('a', a); // prints a 20
 console.log('b', b); // prints b 30
 console.log('c', c); // prints c 40
But as I said, we need to cut time and write fewer lines to be more efficient and productive, right? So, the trick is to wrap your variable inside the curly ’{}’ braces. This is really not a trick but a language feature know as object property value shorthand notation. You can learn more about it here.
  // use object shorthand property value notation
  console.log({ a }); // prints { a: 20 };
  console.log({ b }); // prints { b: 30 };
Doing so, will give you the reference variable along with its value. Less code more value.
Bonus: Use ‘var’ instead of ‘const’ or ‘let’ when declaring variables inside your chrome’s console tab to avoid annoying Syntax Error. ‘var’ is your scratchpad buddy.
2. No more wrapping of curly braces for fat arrow functions
You must have used fat arrow function by now (if you haven’t, you should start using it). They are short and precise and omit the requirement of the curly braces and return statement when writing your function definition.
const foo = x => 2 * x; // how awesome is that 😊
A popular use case would be inside the array utility callbacks (map, filter, reduce, etc)
   let arr = [1, 2, 3];
   let newArr = arr.map(el => el * el); // [1, 4, 9]
Now, let say if you want to debug the map callback function, how would you go about printing the el value? A simple answer would be to refactor the callback and throw in some curly braces around and inject return statement.
let arr = [1, 2, 3];

// using curly braces and return statement
let newArr = arr.map(el => {
 console.log({ el }); // prints {el: 1}, {el: 2}, {el: 3}
 return el * el;
});
What! are you kidding me 🙈? This is not ideal. Not only it’s time-consuming, but reverting back will consume more time too. A better solution is something like this:
   let arr = [1, 2, 3];

   // more concise and inline 🎉
   let newArr = arr.map(el => console.log({ el } ) ||  el * el);
Whoa!! what was that? Don’t worry, it’s just JavaScript. I’ll explain:
There are two things going on here:
- console.log() always returns undefined which is a falsy value.
- Given a statement like expr1 || expr2, Logical OR operator ||, returns expr1 if it can be converted to true; otherwise, returns expr2.
So, return value of console.log({ el }) was undefined and thus second expression el el was executed. The beauty about this change is that you get to see the value inline. No debugger or cumbersome curly* ceremony is required. A big win, right? 😊
This is very handy when you are a fan of functional programming and use a library like Ramda.
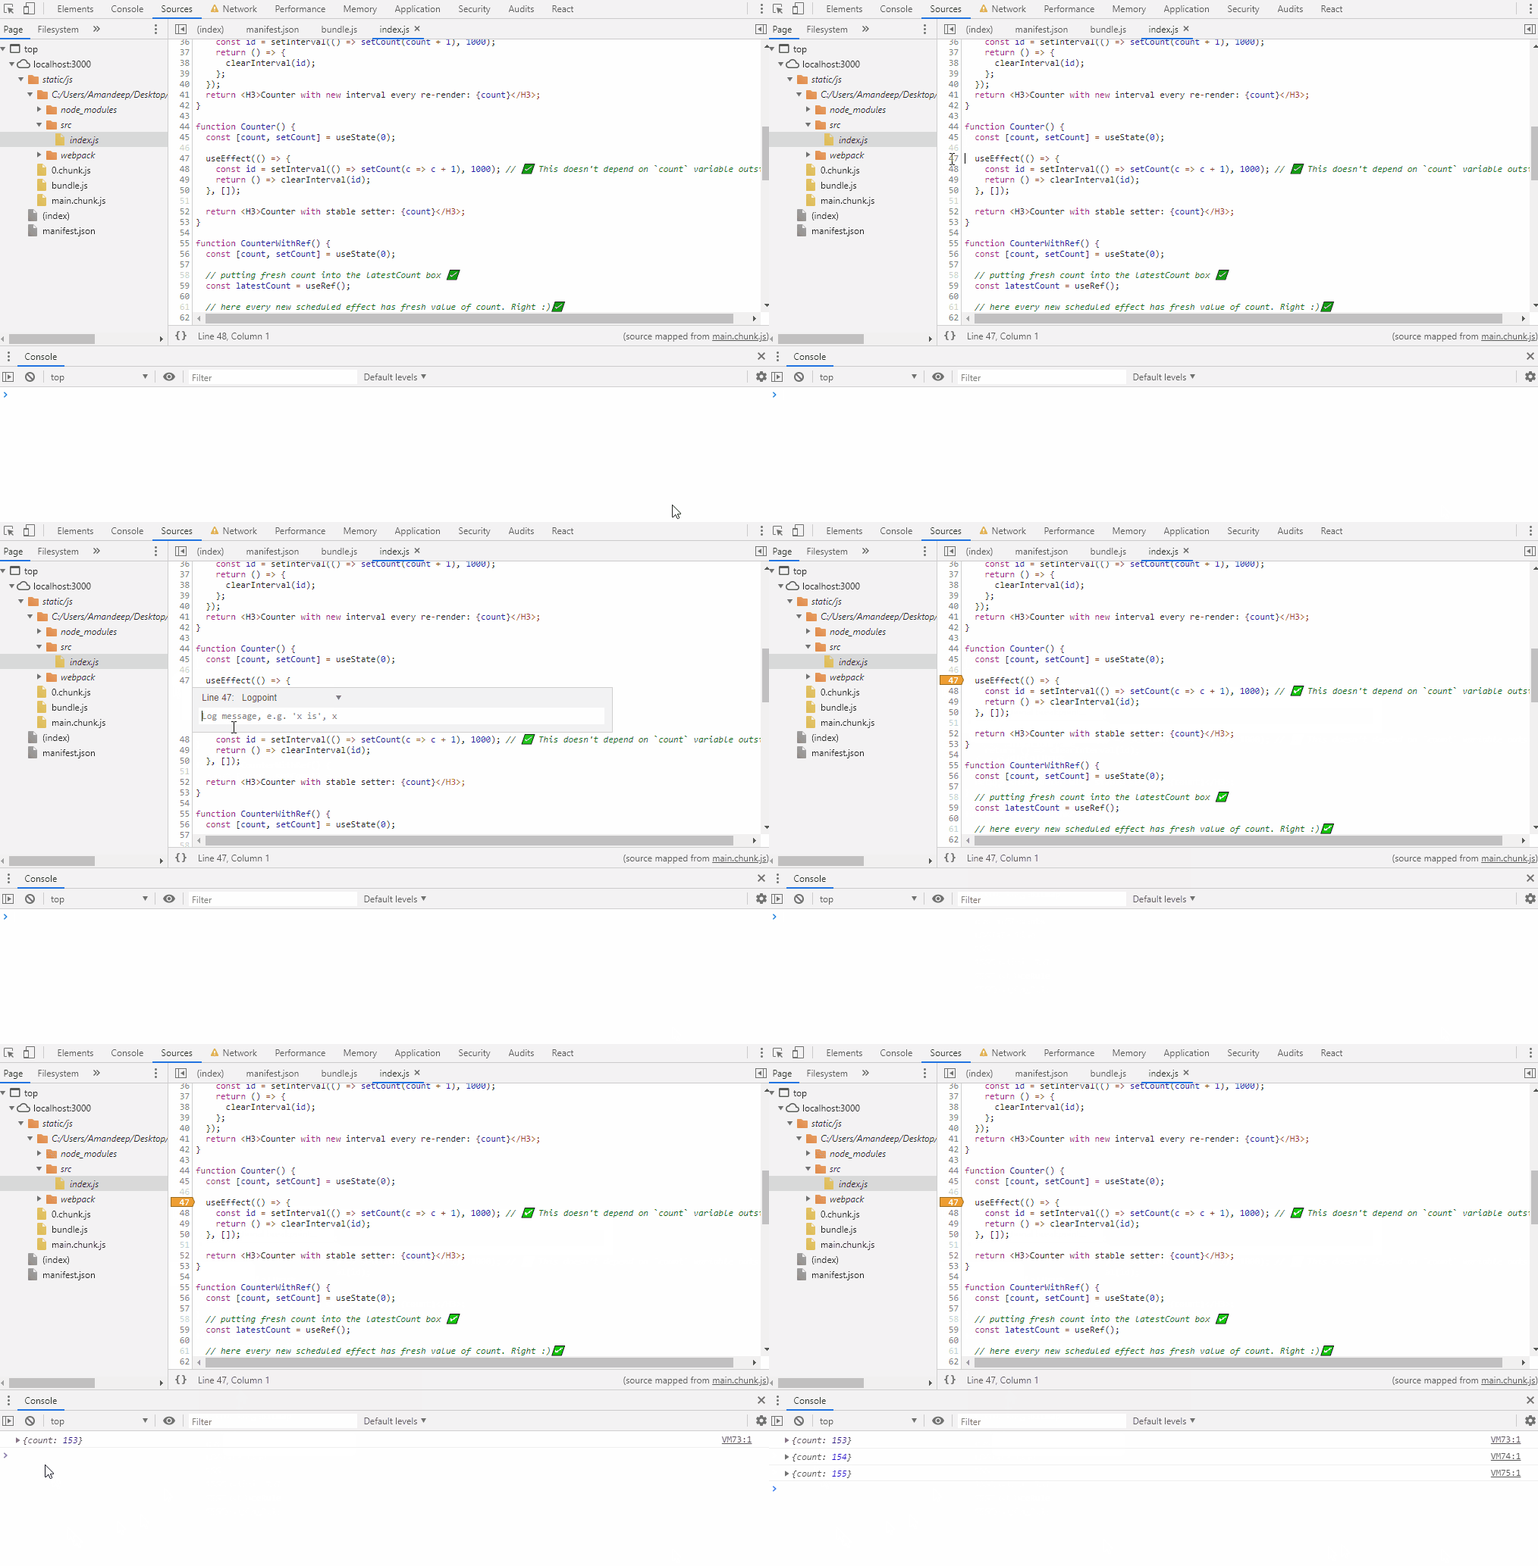
3. Add logpoints—less sprinkling of console.log in your code
The console.log has become an indispensable part of our debugging journey. We tend to sprinkle it everywhere in our code; it has become our first line of defense against bugs. The problem is the cleanup time consumption. You can obviously go and find each console statement and remove them manually. But what if I say there’s a better solution? Embrace new kid in the town—The logpoint.
Google has added this feature in Chrome 73. It allows you to add console statement in your source code straight from your dev tool.
Steps:
- Open Sources section of your dev tool and locate your source code.
- Write click on any of the line number you want to add your console statements.
- A list of options will come up; select Add logpoint.
- A Breakpoint editor will show up allowing you to enter variable name. It’s similar to how you write your expression inside console.log() function.
- Enter a shorthand property notation trick I showed you above. Click outside the editor or hit Enter to save.
- A orange badge will represent your Logpoint and you are all set.
Now, every time your script is executed, you will see the values being logged out at the console section of your dev tool. You can add multiple log points.
Action speaks louder than words:

Bonus: You can also use conditional breakpoint feature to insert a breakpoint when the condition evaluates to true.
4. Store and copying
Chrome dev tool is where I spend most of my time debugging. I use it as my JavaScript scratchpad. It has lots of in-built features at our disposal. One of the cool feature, that has been so helpful for me, is copying the variable value into my clipboard.
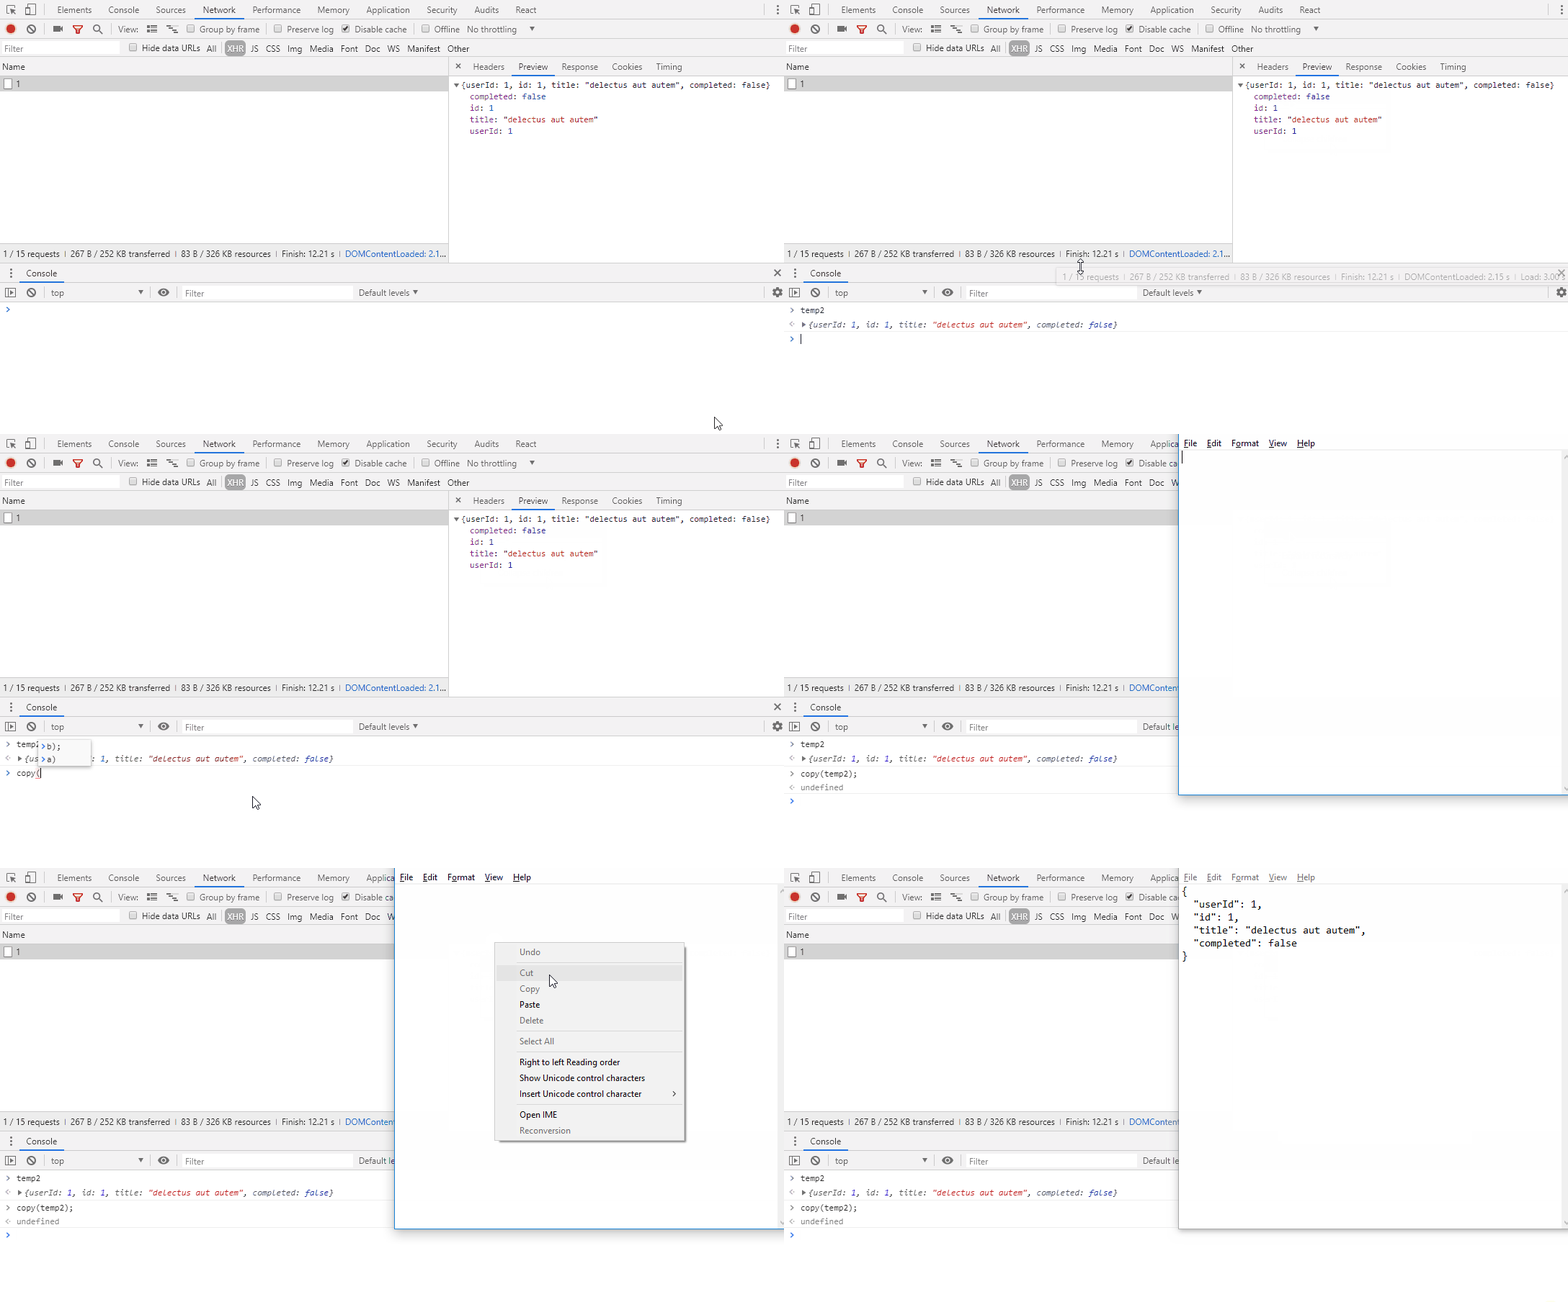
To copy any reference variable, for example x, into your clipboard, just type copy(x) into the console tab and hit Enter. Chrome will copy that variable into your clipboard and you can paste it anywhere by using normal paste command.
The big benefit comes into picture when you are playing around with network response. Here you can combine this copy feature with another excellent feature called store as global variable.
Let’s see that in action:
- Open your Network tab and select a request from the list.
- Open up the Preview section on your right.
- Right-click the property name and select Store as a global variable.
- The variable will be shown in your console tab, and you can use copy() function to have it in your clipboard.
Kill two birds with one stone.

Bonus: You can use ‘Ctrl + f’ to search for a particular string match over the entire response object in the preview section.
5. The Breakpoint for your network requests
Ideally, you should strive to keep your HTTP requests as minimum as possible while building your client. Not only it gives you a smooth performance but also helps to avoid bugs.
In one of our project at Insurance Company, we were building a data-driven UI. Every next question in the form was driven by the user’s previous actions and was fetched subsequently over the wire. We needed to analyse that when a particular kind of request was triggered, we could debug the request payload accurately. I ended up finding this awesome solution called XHR/fetch Breakpoints. It allowed me to put a conditional breakpoint on my fetch requests.
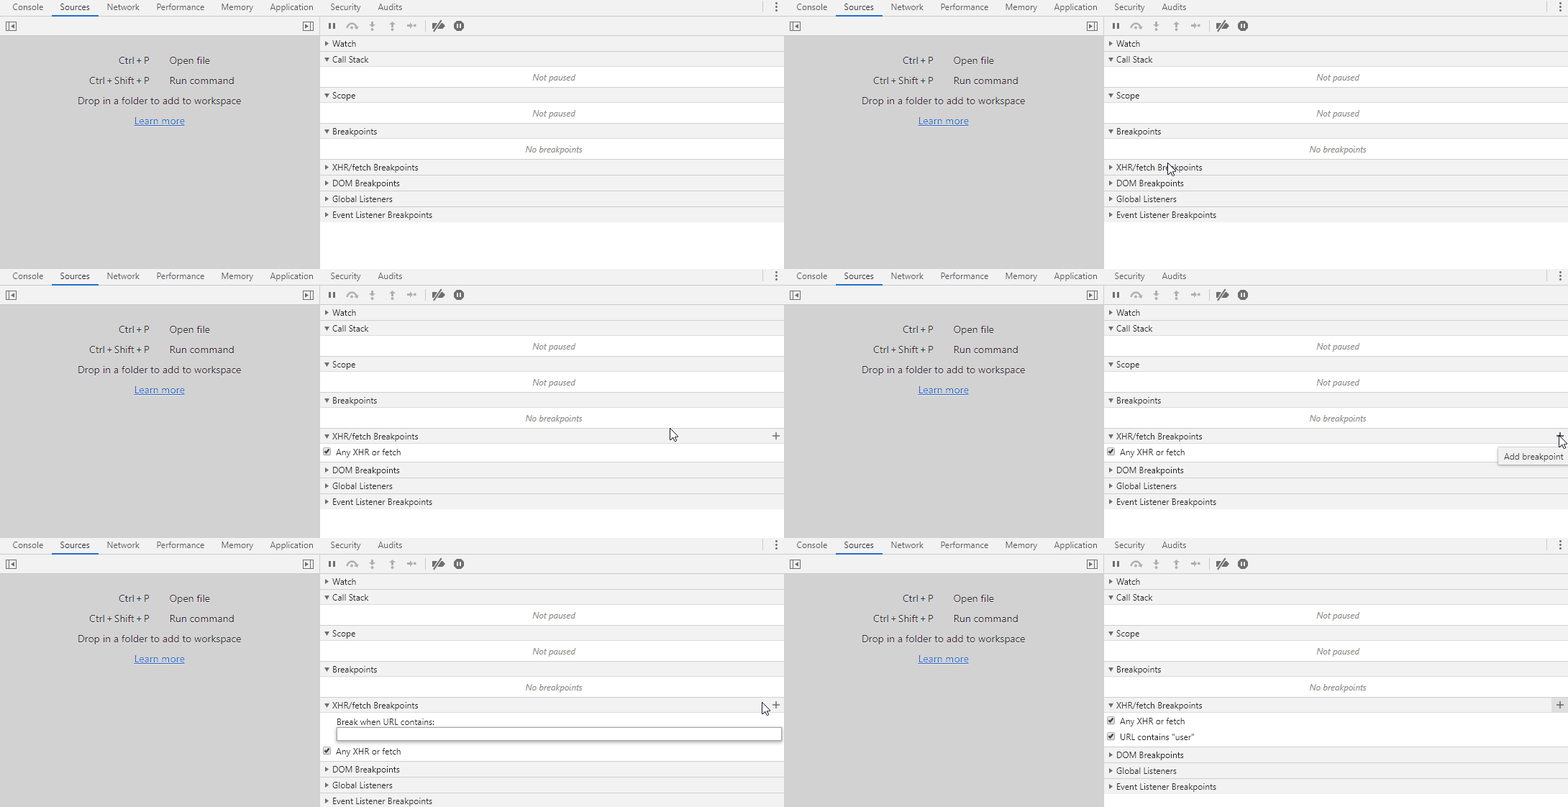
XHR Breakpoints allow you to put breakpoints on all of your network requests. But the real power is the ability to apply breakpoint via ’URL contains’ section. You can throw in any keyword there and chrome will put a pause when it encounters the request URL containing the matching word. How awesome is that!!
Steps are:
- Open Sources tab of your dev tool and on the right side panel.
- You should see XHR/fetch Breakpoint section below Breakpoints.
- Hit + button and a Breakpoint editor should come up asking you to enter the keyword.
- Enter your keyword and hit Enter.

6. Copying your request as cURL
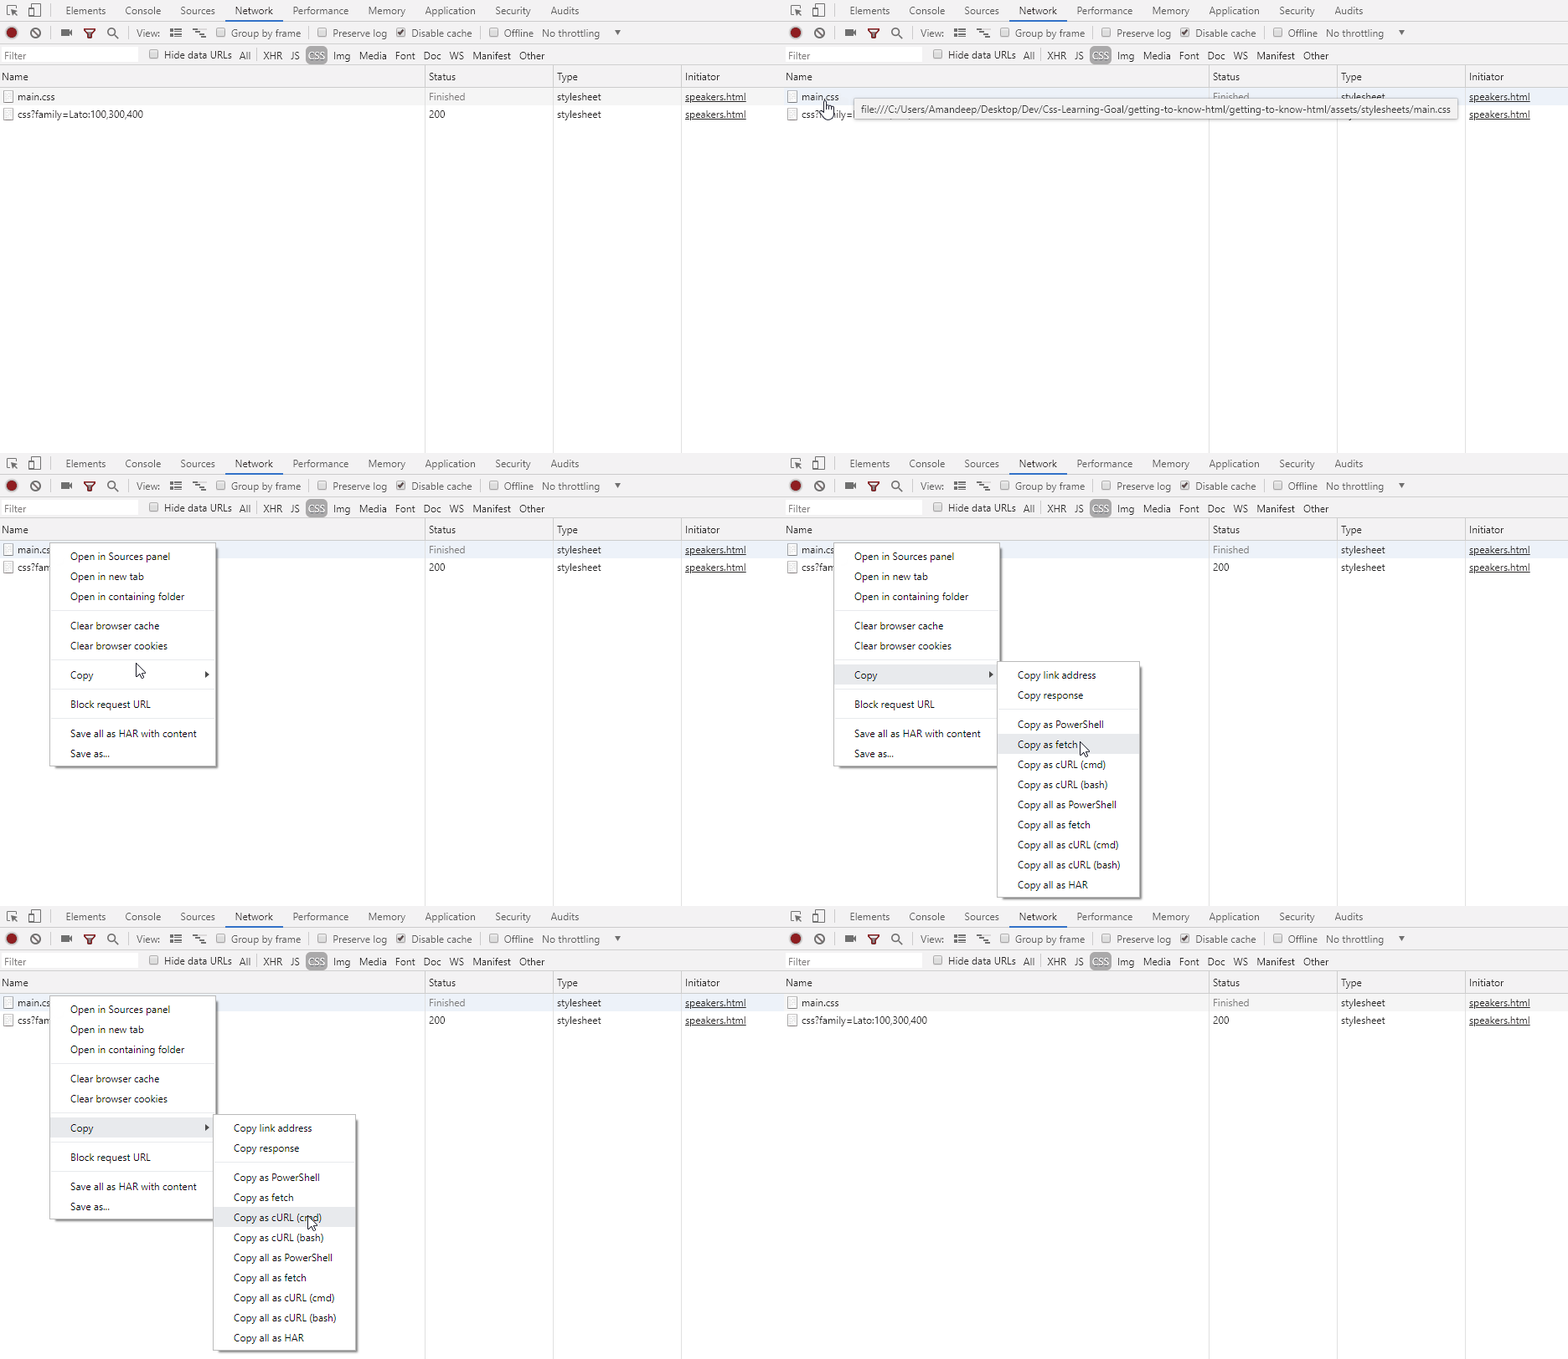
This is handy when you want to trigger your request from a command line too like cmd or bash. You can also paste the copied link into your Postman app and it will fill up all the request headers for you. Very handy in visualising your request.
- Open you Network tab inside your chrome dev tool.
- Locate the request you want to copy and right click to bring multiple options.
- Hovering over the Copy options will show you a list of different format you can copy your request as.
- Select Copy as cURL and it will be saved into your clipboard.

7. Don’t let go off your CSS changes—persist styling when refresh
This tip is dedicated to our UI/Designers friends. We know that via Styles section of Elements tab, we can modify the CSS. But these changes don’t persist when you refresh the page. If you wish to persist the modification you made to the existing stylesheet, you can do this via the following steps:
- Open Sources tab and select Overrides.
- Click Select folder for overrides and select a folder where you want to save your changes.
- A permission dialogue would pop up asking for permission. Go ahead and allow.
- Select your folder and you are all set to rock ‘n’ roll.
Now every time you make changes to your existing styles, they won’t disappear even when you refresh the page.
Note: Adding new style changes won’t persist though!.
Final thoughts
You can’t change the fact that it’s practically impossible to write a 100% bug-free code. Rather than slamming your head against your desk, let’s adapt and develop our debugging skills. Believe me, you will learn a lot by exploring the root causes of your bugs.
I hope you’ve enjoyed reading this article. Write me a tweet if you wish you discuss more about it. Now, go and kill remove some bugs now 🐞.

Written by Amandeep Singh. Developer @ Avarni Sydney. Tech enthusiast and a pragmatic programmer.